Stochastic Rainfall Extension for Auckland's Water Supply
Background & Motivation
Auckland's water supply system relies on ten reservoirs across the Hunua and Waitakere Ranges, supplemented by the Waikato River source. While the ranges have exceptional observational records dating back to 1853, the Virtual Climate Station Network only extends from 1972 to present. This 52-year record is insufficient for characterizing rare drought events and extreme rainfall that drive water security planning.
The fundamental challenge is extending these short records while preserving the statistical characteristics essential for hydrological modeling. Previous approaches using the Stochastic Climate Library produced good results but operated at shorter timescales and did not explicitly condition on the long historical observations. The critical timescale for Auckland's system is 18-24 months, the duration of droughts that stress reservoir storage.
Methodological Framework
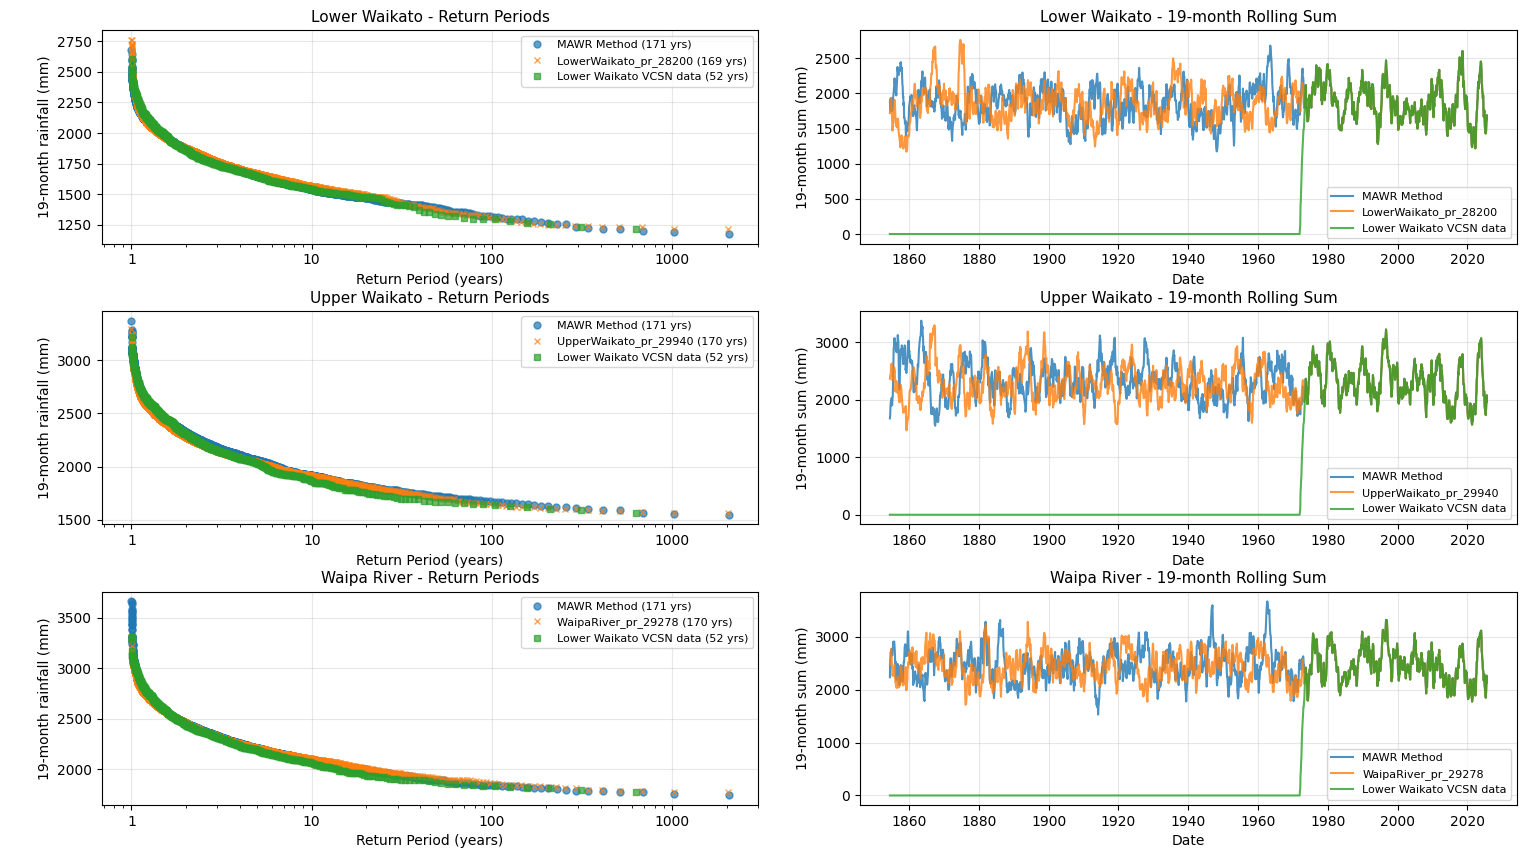
The method operates at the 19-month rolling sum scale to directly capture drought persistence. For each Virtual Climate Station (Upper Waikato, Lower Waikato, Waipa River), the distribution of 19-month totals is modeled using a piecewise approach. The bulk of the distribution uses empirical resampling from observed non-extreme values, avoiding the systematic biases that parametric distributions introduce when modeling mid-range rainfall. The tail is represented by a Generalised Pareto Distribution fitted to exceedances above the 85th percentile threshold.
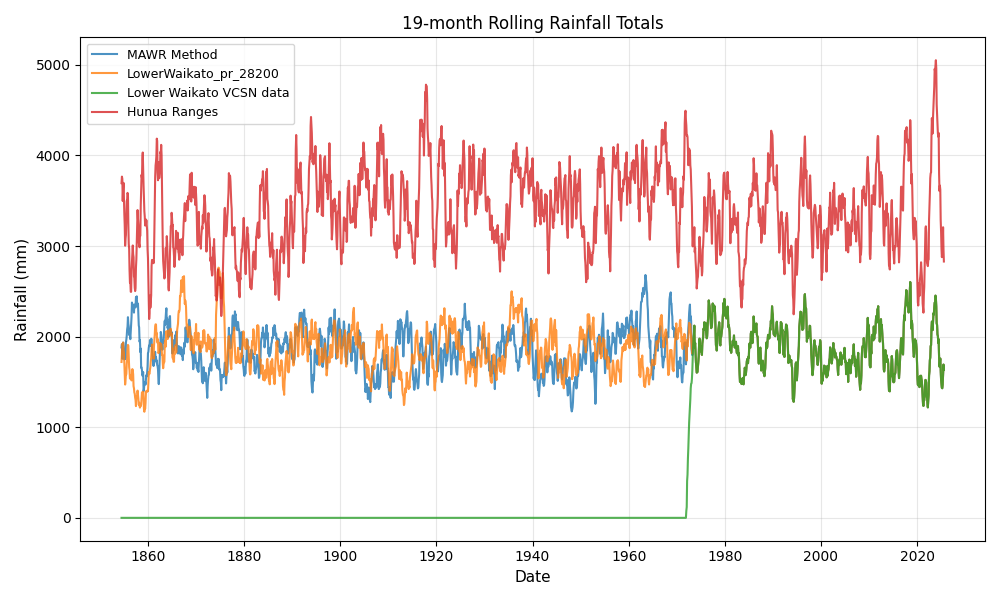
The critical innovation lies in how temporal structure is preserved. Rather than sampling independently, the method extracts an extremeness score from the Hunua and Waitakere gauge records based on percentile rank of their 19-month rolling sums. This score ranges from zero to one and provides a temporal template of wet and dry periods throughout the historical record. When the gauges show extreme conditions, the probability of sampling from the tail distribution at all virtual stations increases proportionally, creating realistic covariance while each site maintains its own statistical characteristics.
Random noise is added to prevent perfect correlation, reflecting the spatial independence between gauge and virtual station locations. The probability of extreme sampling is modulated through p = p_base × (0.5 + extremeness + ε), where ε follows a Gaussian distribution with standard deviation 0.2. This ensures that when historical gauges experienced exceptional drought or rainfall, the extended records reflect similar extremeness while sampling from site-specific distributions.
Disaggregation Through Analog Resampling
Disaggregating 19-month totals to monthly values presented a significant challenge. Initial approaches using proportional scaling from climatological means over-smoothed the results, producing records with insufficient month-to-month variability. The solution employs analog pattern resampling, a technique that preserves natural rainfall structure.
For each simulated 19-month total, the method searches the VCSN record for similar periods within 70-130% of the target value, with preference for seasonally similar patterns. The actual monthly sequence from that analog period is extracted and scaled proportionally to match the simulated total exactly. This preserves the natural clustering of wet and dry months, the intensity of individual extreme months, and the seasonal characteristics of the rainfall regime.
The monthly values are then disaggregated to daily using VCSN climatology. Daily proportions are calculated as the typical fraction of monthly rainfall occurring on each day, derived from the full VCSN record. These proportions are applied to the simulated monthly totals, with normalization to ensure conservation of mass. For the VCSN period itself (1972 onward), original daily values are retained.